Data dashboards – also for engineering
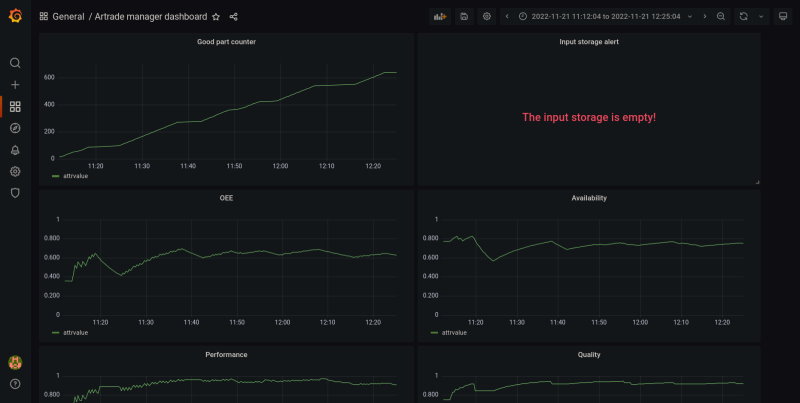
Dashboards have been on the radar of the manufacturing industry for a while. They show up more and more, sometimes connected to the cloud, sometimes integrated with local solutions like a MES or Scada. In most cases, they’re used to monitor energy consumption, production rates or operational equipment effectiveness (OEE). Having such dashboards allows operators and management to continuously keep an eye on important production parameters. What they see can lead to action, (production) process improvement or changes in the setup of production lines.
The data needed for this typically comes from digital equipment, like sensors and controllers (PLCs), or from human input, eg from metal workers indicating on a screen or through a barcode scan when they start and stop a certain job. We can also add analog signal sensors with a digital output to an existing system, for example to measure current on an analog machine to see if it’s running or idle. This opens up dashboard functionality for older, non-digital equipment.
Faster analysis
A simple dashboard example is a check on the amount of discarded material or product in a certain production step. Let’s say a product is made of rubber and the dashboard shows that after running the material through a mold, 12 percent of the resulting products get thrown out. The dashboard can make this visible in real-time, together with the exact batch of rubber used and production parameters like temperature, air pressure and humidity. It’s possible to show these next to a longer-term trend, enabling an operator or production manager to see whether there are patterns. If so, these can be analyzed further to check if changes in material, temperature or pressure reduce the percentage of discarded products.

Another possible use of dashboards is by the engineers building and maintaining the production machines. Each of the systems contains an army of sensors and actuators to control – sticking to the example – temperature, pressure and humidity. The pressure of air or hydraulics, for example, is controlled by valves and set in a closed loop: sensors continuously measure the pressure, after which a controller (eg a PLC) steers it to a pre-configured setpoint. For engineers, it could be useful to monitor this process. It allows us to look for small and infrequent pressure variations or to check whether the controller is missing a necessary update.
This becomes important when the process issues in the production dashboard are found to have a technical cause. Having a technical dashboard helps minimize the analysis time by lowering the need to go through log files and reducing the amount of traces to set to find out what’s going wrong. Combining these two types of dashboards in one environment allows for even faster analysis.
An example
Let’s consider a slightly bigger example: a production line in a factory of a big food manufacturer. In this production line, all kinds of solid, liquid and powdered ingredients are handled. They’re dosed, cut, mixed, heated up, cooled down and in the end, come together in a final product.
Operators in such a factory may use a dashboard showing the progress of orders and the status of production lines as well as a screen providing a live view of the factory (a Scada HMI) that’s used to handle errors and alarms. On the dashboard, they see information like the temperature and pressure in certain areas, the number of batches or kilograms processed per machine and probably some graphs with changes in these values in the course of a shift. This helps them run the factory and keep track of their planning and efficiency.
If the air pressure drops on one of the transport lines, this affects every air-controlled lifting system, pressure transport (blowing powders through pipes) and air-based cleaning operation. In severe cases, parts of the system will shut down and the operators are alerted immediately, so they can take action. Unfortunately, the pressure drops may also be small or gradual – or worse, intermittent – making it hard to nail the real reason for an alarm.
In such cases, a dashboard that allows to look at slightly older data may be useful on a more technical level. We’d find the pressure across different parts of the system, on the level of valves, tanks and outlets. These are things a production operator doesn’t need to see or know daily, but a mechanic or support team does. In case of an intermittent problem, they can use the technical dashboard to check the status and compare it to possible previous occurrences. This way, they’ll find correlations that may lead to causes.
ChatGPT?
Can’t we use AI instead of a human with a dashboard? Of course, someone is bound to ask this. It’s a very valid question in times of a hype, especially one that actually has useful spin-offs.
However, what most people refer to when talking about AI are ChatGPT and similar systems. These are large language models (LLMs), which learn to respond to questions by training them with a lot of text. They’re much less suitable for analyzing the data we’re talking about here.
Other models, like Bayesian networks and reinforcement learning, could be used to construct such analysis systems. Unfortunately, these are trained on historical data and feedback on their responses as well. As a result, they won’t be functioning ‘from day one,’ also because every production line is in a way unique and has its specific quirks and characteristics.
Having the data collected for dashboard use and then moved to long-term storage would allow such applications to be developed over time. However, that won’t remove the need and added value of dashboards for now.
Main picture credit: Michael Held on Unsplash


